Devpost
Participate in our public hackathons
Devpost for Teams
Access your company's private hackathons
Grow your developer ecosystem and promote your platform
Drive innovation, collaboration, and retention within your organization
By use case
Blog
Insights into hackathon planning and participation
Customer stories
Inspiration from peers and other industry leaders
Planning guides
Best practices for planning online and in-person hackathons
Webinars & events
Upcoming events and on-demand recordings
Help desk
Common questions and support documentation
This chrome extension is a fast and convenient search tool that provides fast access to first page results on various shopping sites.
E+ is a website for everyday consumers to get the most savings from every purchase. Internet shopping has never been made this easy and efficient, sign up today.
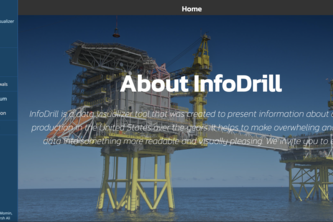
Our take on a solution for oil and gas production in the U.S.
A metasearch engine for purchasing flights that best meet your personal preferences.
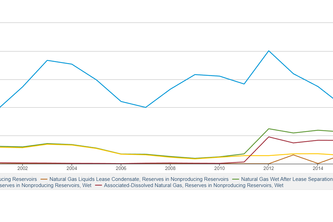
Our goal for this project was to contruct relevant data from different sources. We compiled US oil production, GDP and CPI. We contructed models to determine any correlations and drew conclusions.
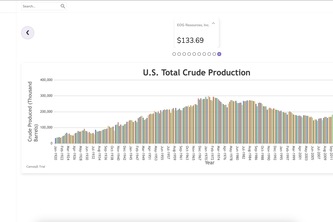
Presenting Oil and Gas Statistics with easy-to-read visuals.
A data visualizer for Oil and Gas production in the U.S.
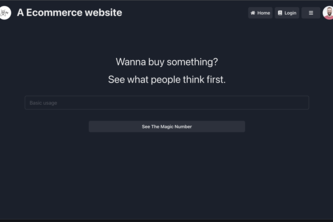
We've created a hub for e-commerce, allowing users to access, filter, and buy products without having to search hundreds of websites.
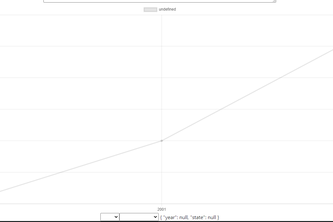
Dynamic Charting system for analyzing trends in oil production. It takes csv files with date, state, and barrel amount and then creates a chart showcasing the trend.
I pushed buttons for many hours to make this.
Are you tired of searching for the right apartment? Not sure if their as good as they say? Look no farther! Better apartment finder shows you various metrics to help you find a quality apartment.
Pokémon game like on the DS but doesn't work exactly the same. General Challenge
A product meant for customers to use to scrape the internet more easily and have the information they want more easily and exactly what their looking for.
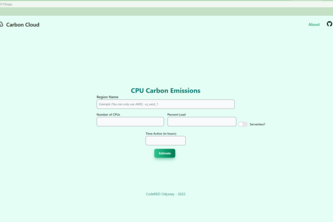
As hackers, we're known to take on several personal projects, which end up in the cloud. But, storing web apps, APIs, etc. comes at a cost. So why not know how much carbon your web app is emitting?
A one-stop shop to see the US Oil Production and some helpful information about US natural gas. This dashboard can also help narrow down specific trends of oil/gas stocks as well
Have you ever felt like your fashion didn't reflect your personality enough? Welcome to STYLEYEZ! Where you can choose your outfits based on your desired aesthetic!
customizable UI based on LUXURY index
100+ refineries, 700 million+ oil barrels pumped.Every big decision, guided by Petrolytics.
Changing this later
Surfing the web for you to find the lowest prices for an item.
In our project, we aim to shed light on oil and natural gas usage for the states in the United States using data visualization techniques.
(ConocoPhillips Challenge) Waku Waku is an interactive UI that gives users insights on oil/gas production in the US over the years. It's also the key to saving the world.
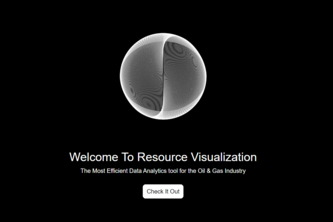
An efficient data analytics tool for the oil and gas industry.
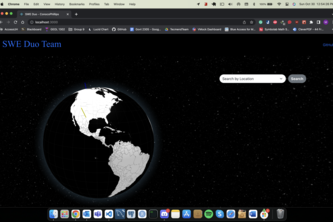
An interactive 3D website that displays oil and gas production in the US.
25 – 48 of 52